Personal Project
TokenTach
A macOS menubar app that monitors LLM token throughput in real time. Tails log files from Claude Code and Codex, shows live tok/s on a tachometer gauge, tracks costs, and generates shareable stat cards.
TokenTach is a macOS menubar app that bolts a tachometer to your AI coding stack. It watches log files from Claude Code and Codex as they stream responses, parsing token counts, model info, and timing data in real time. The main view is a gauge showing current tokens per second alongside sparklines, stat pills, and per-source breakdowns. You can flip to cost tracking mode to see estimated spend as a $/hr rate instead.
I didn’t write a single line of code in this project. Not the Rust backend, not the Svelte frontend, not the animation engine, not this writeup. The whole thing is AI-generated, start to finish. I just had opinions about how a gauge should feel.
How it happened
I was deep in other AI-assisted work, running Claude Code and Codex side by side on real projects, and wanted something to chew on. A side quest. The idea was simple: what if I could see token throughput the way a car shows RPM? A tachometer for my AI tools.
What started as a “let me see if this is even possible” turned into a complete macOS menubar app in a single sitting. Not because I planned it that way. One thing kept leading to the next. The gauge needed to feel right, so the animation engine got deeper. The animation needed to be tuned, so exploration docs got written. The app needed personality, so 100 taglines got curated. Cost mode got added because I was curious what I was actually spending.
The whole build happened through conversation. Describe what you want, look at what comes back, steer it, repeat. The findings/ directory in the repo is a good artifact of how that works: design exploration documents written mid-build, weighing tradeoffs and picking approaches, all generated through back-and-forth with AI.
The gauge obsession
The gauge is the whole point of the app. It’s what you glance at 50 times a day, and if it doesn’t feel right, nothing else matters.
There’s a GaugeFeelEngine class that runs five layered sine waves at incommensurate frequencies (2.3, 3.7, 1.1, 5.3, and 0.4 Hz) with cross-modulation between layers. Phase 3 gets modulated by phase 1, phase 4 by phase 2. The result is pseudo-random micromotion that never visibly repeats, making the needle feel like a real analog instrument even when the signal is steady.
On top of the noise layers, the engine handles:
- Exponential decay with a 2.5-second half-life so the needle winds down gradually instead of cliff-dropping when throughput stops
- Idle jitter that amplifies quadratically below an activity threshold, keeping the gauge alive at rest
- Velocity-reactive oscillation at ~1.35 Hz that creates mechanical overshoot when the signal changes fast, like a physical needle settling after a burst
The gauge max adapts too. It ratchets up instantly on peaks but decays exponentially (half-life ~23 seconds) toward the rolling 60-second peak. A floor of 100 prevents the range from collapsing during idle. An exploration doc in the repo weighs five different approaches before landing on this one: adaptive range with decoupled best marker and a 1.3x headroom multiplier.
What it monitors
The Rust backend runs separate watcher threads for each source:
Claude Code logs live in your projects directory as JSONL files. TokenTach tracks per-request token usage (input, cache read, cache create, output) and calculates TTFT by measuring the gap between a user message and the first assistant response in the same session.
Codex writes rollout JSONL files in ~/Library/Application Support/Codex/sessions/. TokenTach parses token counts, cached input ratios, and rate limit utilization from each event.
Both watchers use the notify crate for filesystem events with a 2-second polling fallback for macOS FSEvents edge cases. They maintain per-file offsets and tail incrementally. Memory stays bounded: 40 recent events max, stale file entries evicted every 10 minutes.
Views
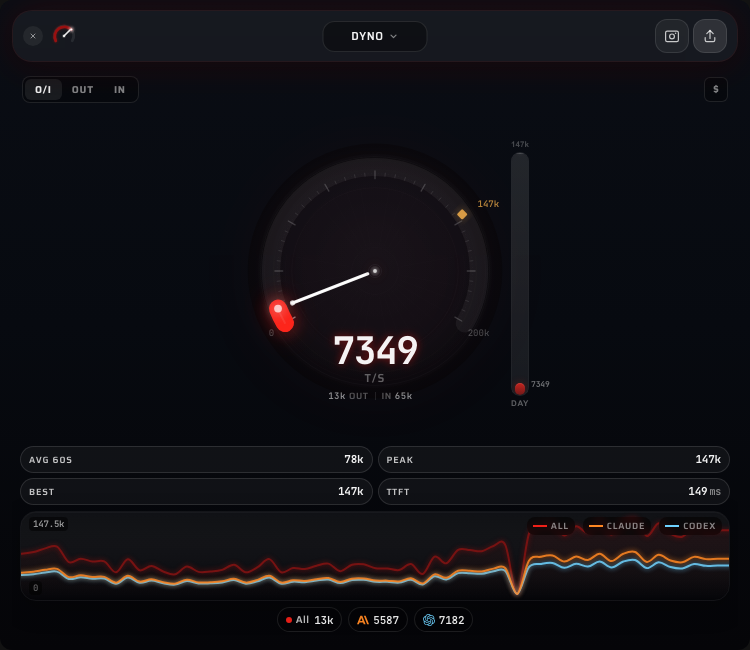
Dyno is the default: live gauge, sparkline, four stat pills (avg 60s, peak, all-time best, TTFT), plus a breakdown toggle for input/output/combined metrics. The sparkline shows the last 60 seconds of throughput history.
History adds a time-range selector (day, week, month) with aggregated charts and cumulative stats.
Sources shows per-source cards (one for Claude, one for Codex) with individual throughput and an event log panel.
Settings has watcher toggles, auto-update configuration, and a button to replay the welcome walkthrough.
Share cards
TokenTach generates 1080x1350 PNG share cards rendered entirely on canvas. The card pulls your live stats (hero number, input/peak/best/TTFT), draws a decorative gauge arc with the teal-to-red gradient, picks a random tagline from the pool of 100, and adds ambient bloom effects and noise grain for texture. Source breakdowns go at the bottom with colored dots (amber for Claude, cyan for Codex).
The taglines range from racing metaphors (“Rev limiter? Never heard of her”) to self-aware developer humor (“10x developer, 9x is the AI”) to pure chaos (“Tokens georg, who generates 10,000 per second, is an outlier and should not be counted”).
The design system
The whole UI is built on a “void glass” aesthetic. Background is near-black (#050508) with subtle ambient bloom gradients in cyan and amber. Panels use frosted glass materials: rgba(255, 255, 255, 0.04) backgrounds with 40px backdrop blur and 1px semi-transparent borders. Text follows a three-tier hierarchy at 92%, 60%, and 35% white opacity.
The gauge gradient runs from teal (#4ECDC4) through cyan (#7DDFFF) to amber (#FFB74D) to red (#FF6B6B), matching the throughput level. Fonts are Saira for display text and JetBrains Mono for numbers. Every transition uses a custom ease-out curve (cubic-bezier(0.2, 0.9, 0.2, 1)) at 200ms.
The findings directory
A findings/ directory in the repo captures design exploration documents written during the build. Three topics got the full treatment:
Adaptive gauge design compared five approaches to auto-ranging (fixed scale, nonlinear mapping, dual range, decaying best, and the hybrid that won). Each option got a pros/cons table and edge case analysis for zero throughput, sudden bursts, sustained load, and burst decay.
Event log redesign worked through what developers actually want from a session log. Prioritized by the questions people actually ask (“How much have I spent?” beats “What was the 37th event?”).
Share card design specced the full layout zone by zone: top bar with logo and tagline, hero zone with the decorative gauge and big number, stats strip, and bottom bar with source breakdown. Color math for the ambient blooms, noise sample counts, glass border radii. Everything needed to reproduce the card from scratch.
Stack
Tauri 2 for the native macOS shell (menubar positioning, auto-updates, code signing). SvelteKit with Svelte 5 runes for reactive state. Rust for the filesystem watchers and JSONL parsing, with SQLite via rusqlite for local persistence. The gauge and sparkline animations run at 60fps using rAF-driven tweening with asymmetric attack/decay (400ms up, 1200ms down). Number formatting adapts by context: full precision in stat pills, compact notation on the gauge face, cost-specific formatting for the dollar mode.
Key Takeaways
- Gauge feel is 90% of whether a real-time dashboard feels alive or dead
- Five noise layers at irrational frequency ratios create organic motion that never visibly repeats
- Writing exploration docs mid-build forces you to articulate why one approach wins
- You can go from "I want a tachometer for tokens" to a signed macOS app in a single sitting if you let the AI drive